I get asked frequently when is the right time to transfuse an anaemic patient?
The difficulty lies in the fact not all anaemic patients require blood transfusions. Just because a patient has pale mucous membranes does not mean the patient needs a transfusion.
The term commonly brought up during the discussion is “transfusion triggers present”.
What constitutes a “transfusion trigger”?
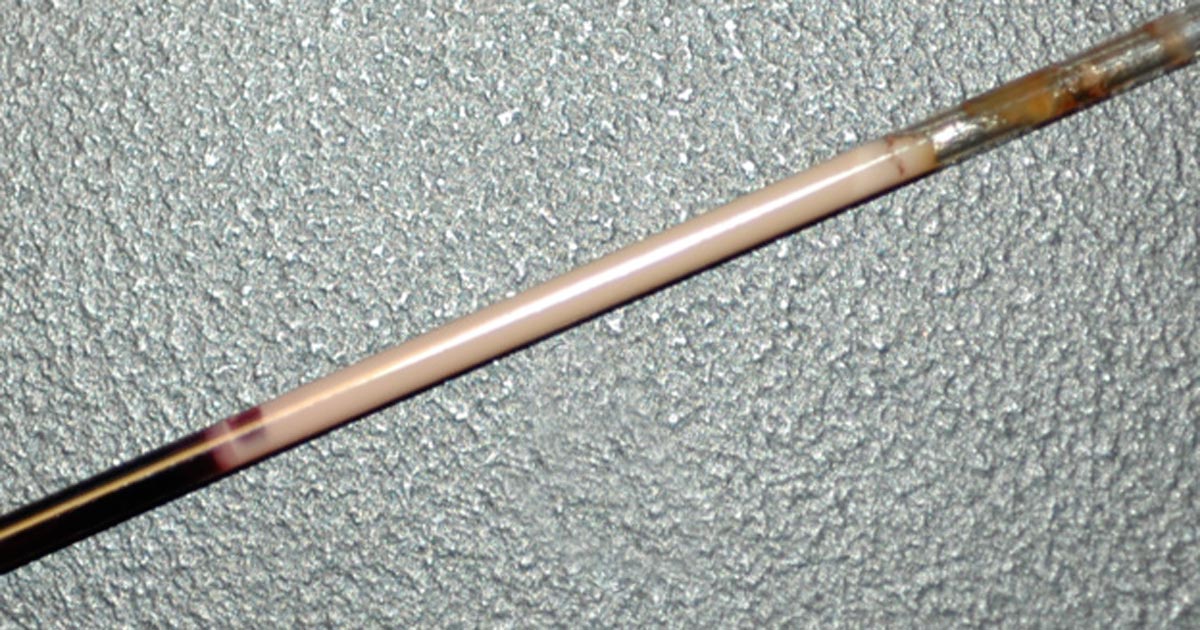
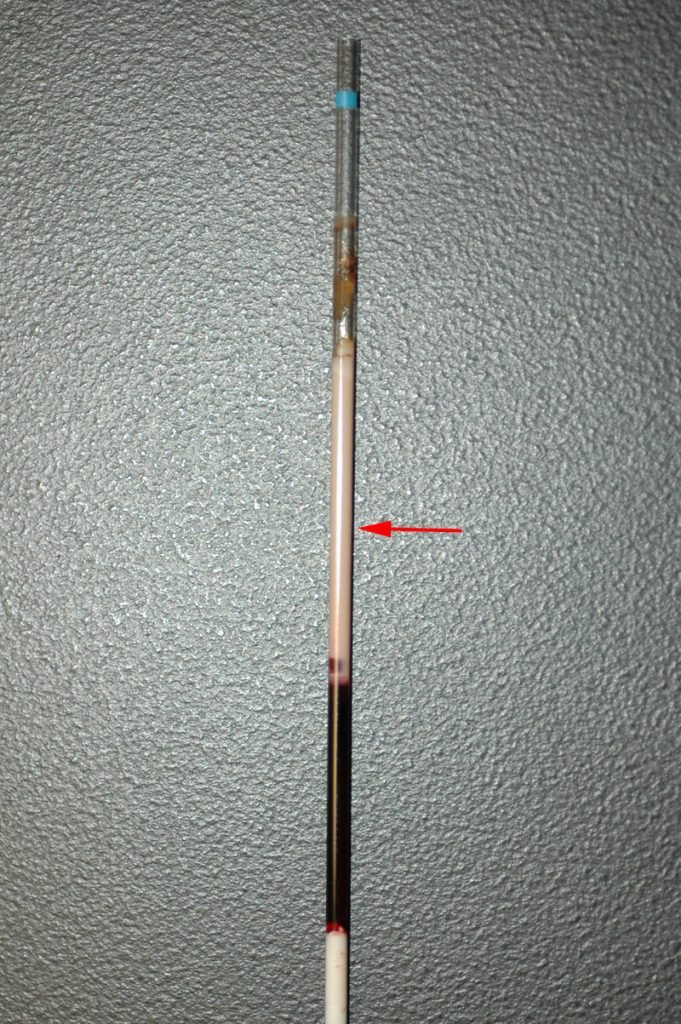
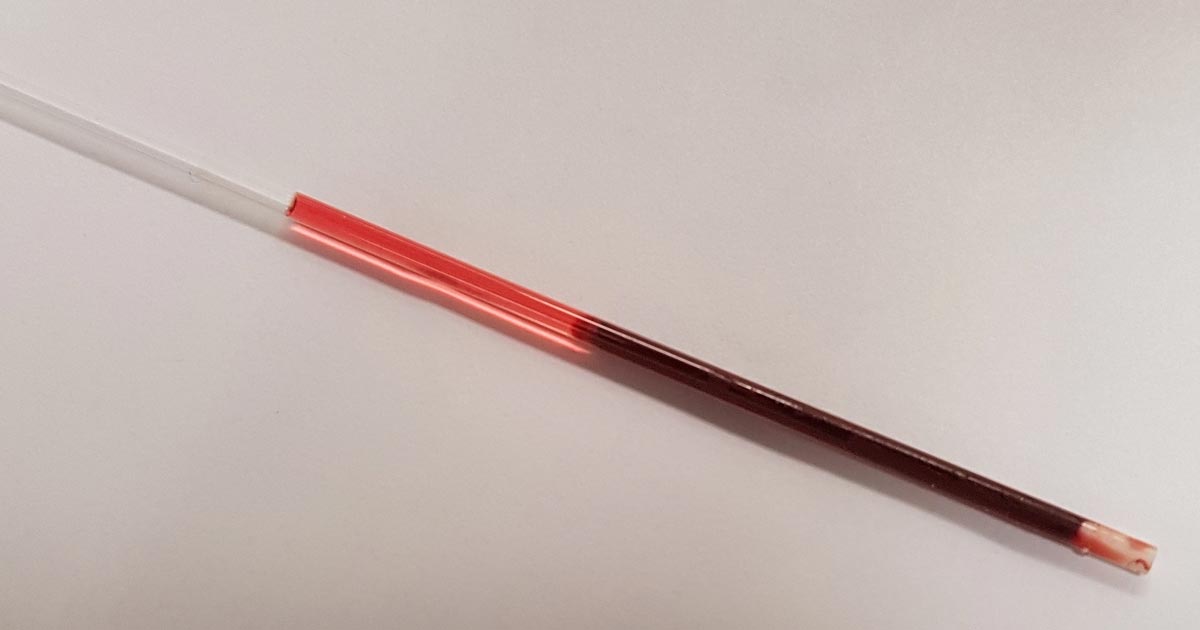
A couple of different definitions exist: classically, it is the PCV or haemoglobin level at which a transfusion is indicated in an individual animal – essentially, if it gets below a certain number, transfusion is required – but it is not always that simple. Just because the PCV is 15%, it doesn’t always mean a transfusion is required.
When the PCV drops low enough, clinical signs of reduced oxygen delivery to the tissues start to develop, these include:
- decreased exercise tolerance
- weakness
- dull mentation
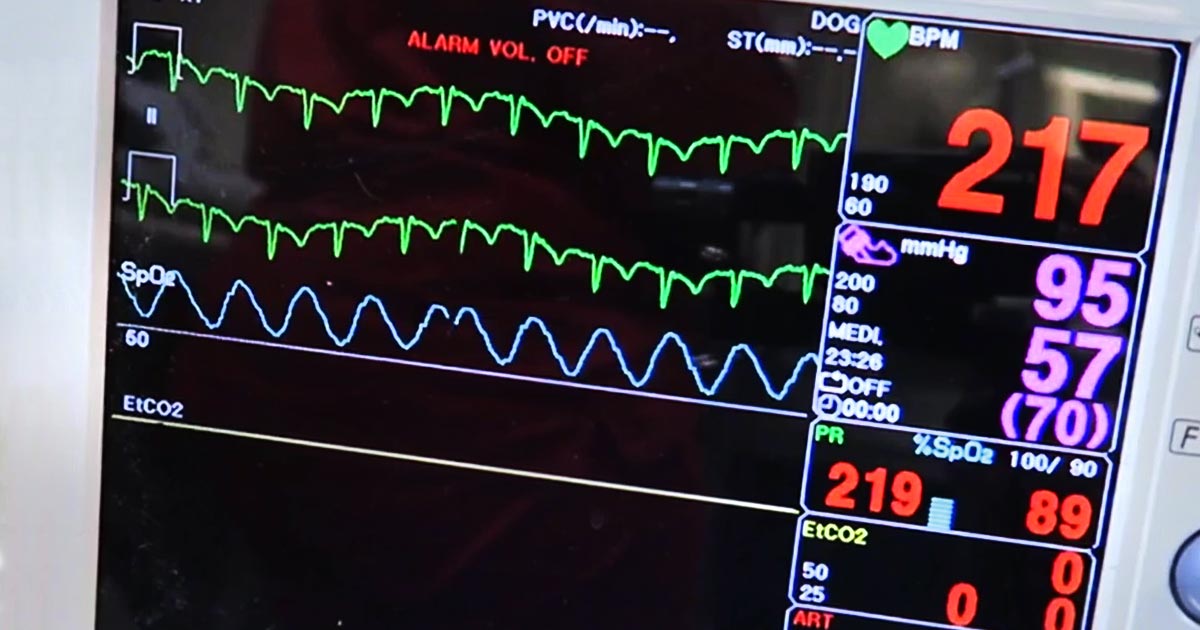
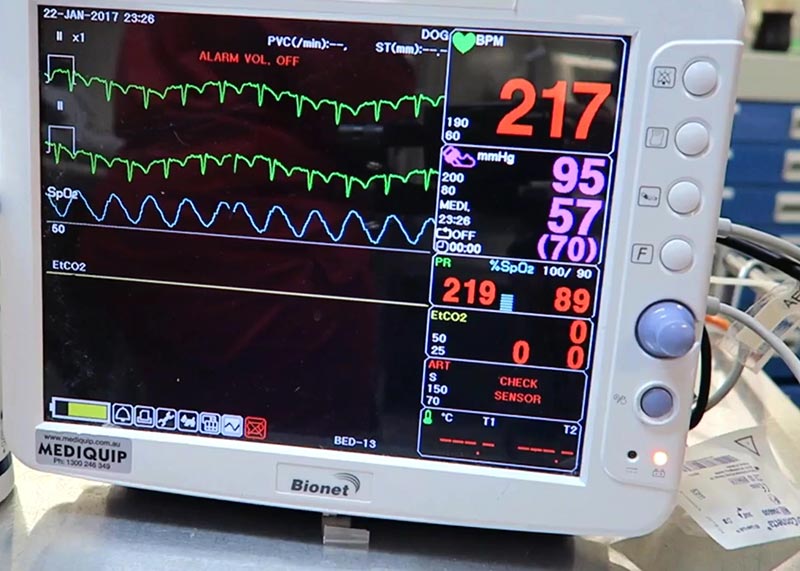
- tachycardia
- tachypnoea
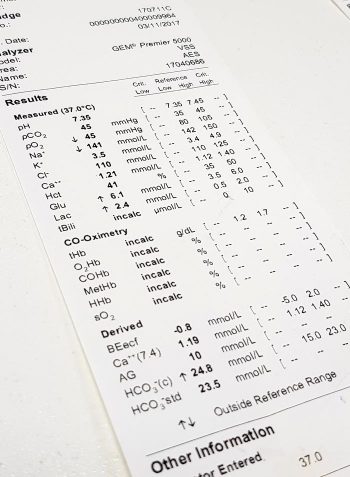
- elevated lactate levels when shock has been addressed
Rapid or slow?
These clinical signs are influenced by the speed at which the anaemia has developed.
If the anaemia has occurred rapidly due to internal bleeding from trauma or a ruptured organ, these clinical signs can present in a matter of minutes, depending on how big the bleed is. This means a transfusion might be indicated when the PCV is still 25%, especially if further rapid blood loss is likely.
If the anaemia developed over days to weeks (slow red cell destruction or anaemia of chronic disease, for example) transfusion triggers might not be present until the PCV drops below 15%, as the body has had time to compensate.
Summary
So, in summary, the decision-making process involves asking the questions:
- What is the PCV?
- How fast has the anaemia developed?
- Are there clinical signs of reduced oxygen delivery?
- Is further loss likely?
When you combine the core aspects of each of the questions above, “transfusions triggers” change from absolute numbers to this:
- PCV under 15% with clinical signs of reduced oxygen delivery.
- Rapid PCV drop to under 20% in dogs and 15% in cats.
- PCV under 25% and surgery or anaesthesia is required, and/or rapid ongoing blood loss is occurring.
Blood products you should use and why will be covered in a future post.
Note: Haemoglobin levels should also be assessed in conjunction with the PCV.
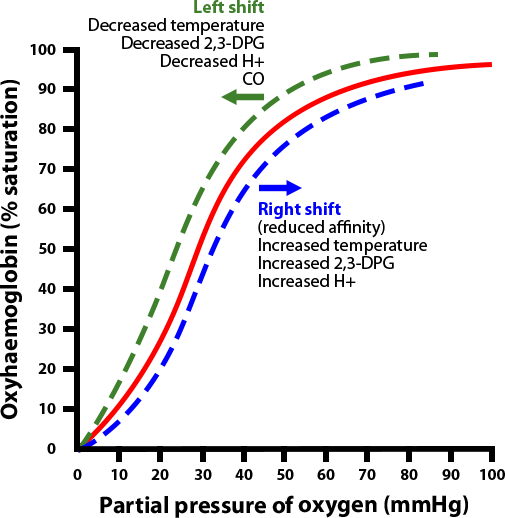 By the same token, a shift of the curve to the left means the Hgb has an increased affinity for oxygen, so is less likely to release it to the tissue. This normally occurs in the lungs.
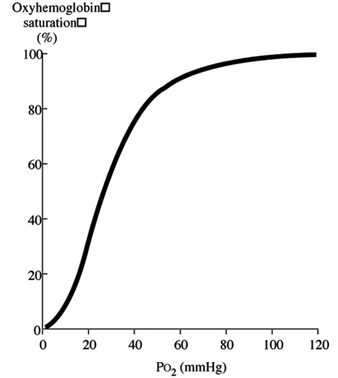 Initially, when the first oxygen molecule binds to Hgb’s, a change occurs in its conformation that increases its affinity for subsequent molecules of oxygen and, thus, hasten binding. This is depicted by the steep part of the OHDC curve.