Category: Opinion

  • Cutting edge (Goad in Goa, pt 2)

    Cutting edge (Goad in Goa, pt 2)

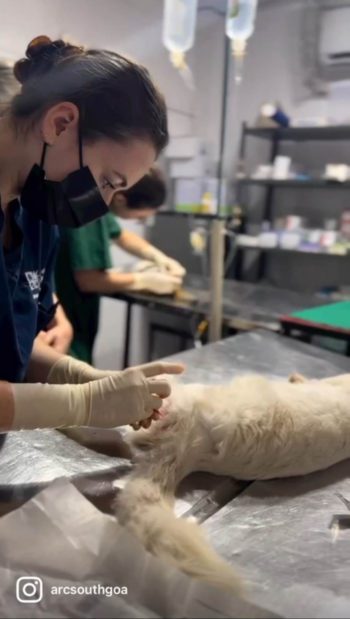
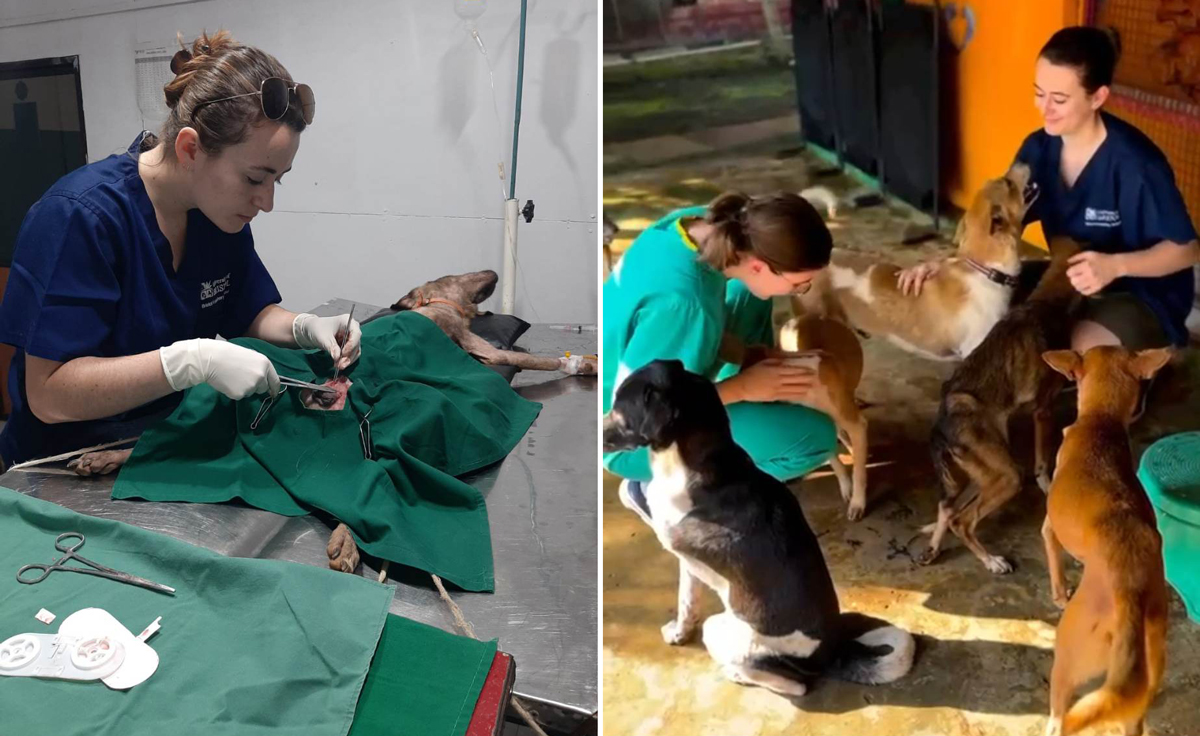
    My recent trip to India comprised two weeks of intense sun, gorgeous beaches and delicious food that truly tested the constitution of my stomach. The majority of my time, however, was spent doing what I had gone all the way out there to do: surgery – lots and lots of surgery!

    After 10 weeks of my clinical EMS was shut down by the pandemic, I had felt the desire to both travel and gain extra experience wherever possible, and so a surgical course based in Goa sounded like the perfect solution.

    Spays for days

    Image courtesy Animal Rescue Centre, South Goa.

    For my friend and I, the holy grail of all surgeries was the dreaded bitch spay. At the end of our placement – after what we presumed would initially be just watching, then maybe some helping, probably followed by a whole lot of cat castrating (the gateway surgery for newbies) – it was our hope that we would maybe (maayyybe) even be allowed to attempt a bitch spay for ourselves.

    It didn’t ever occur to me that I would be executing my first bitch spay, from start to finish, by day three. Nor did I ever imagine that I would leave having done a total of 10… essentially one per day (although on some days we did two each).

    Ironically, cat castrates were few and far between – even dog castrates for that matter – and of the 25 total surgeries I performed in those weeks, 16 were spays.

    Left in the dark

    The main thing I took away from the trip (aside from sore fingers) was a newfound appreciation for the fundamentals of surgery.

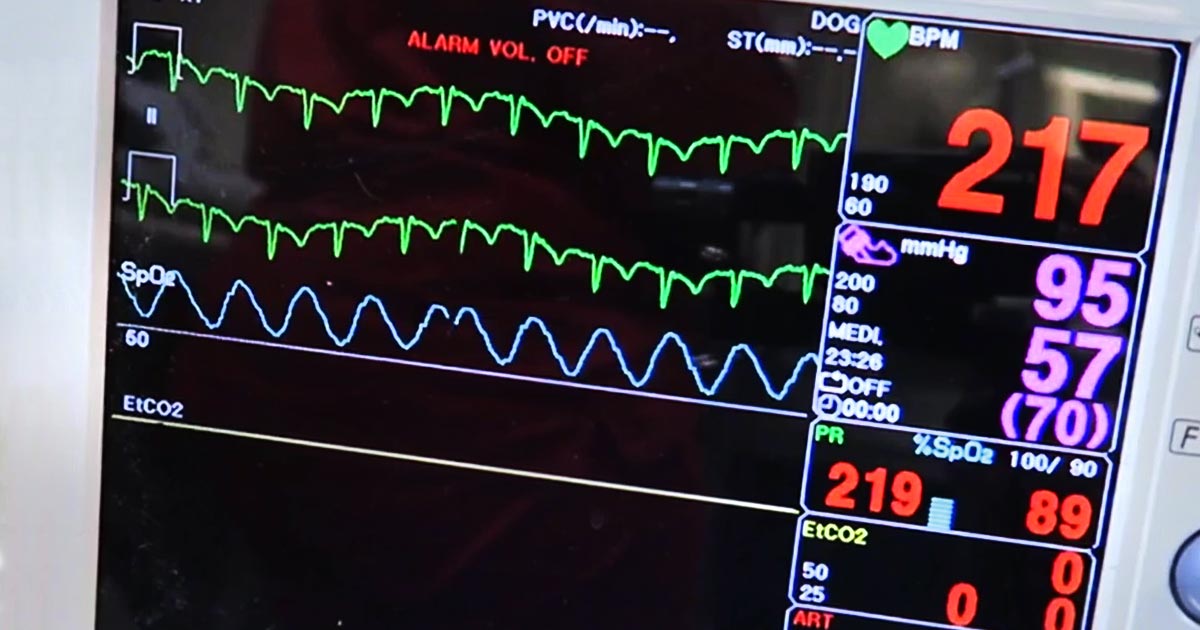
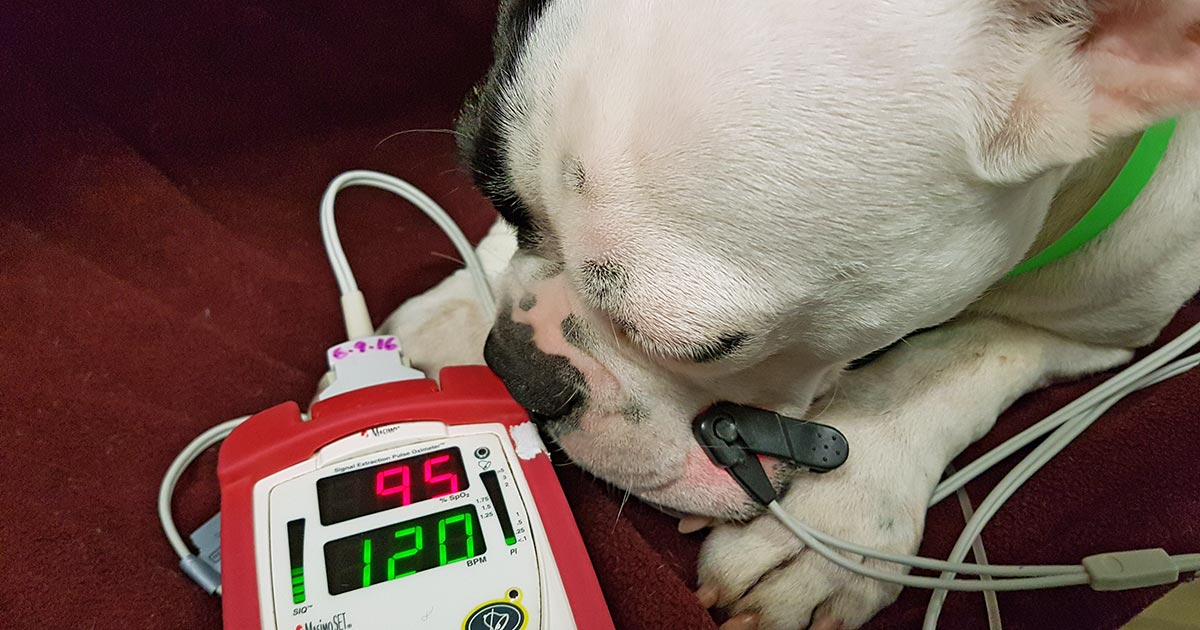
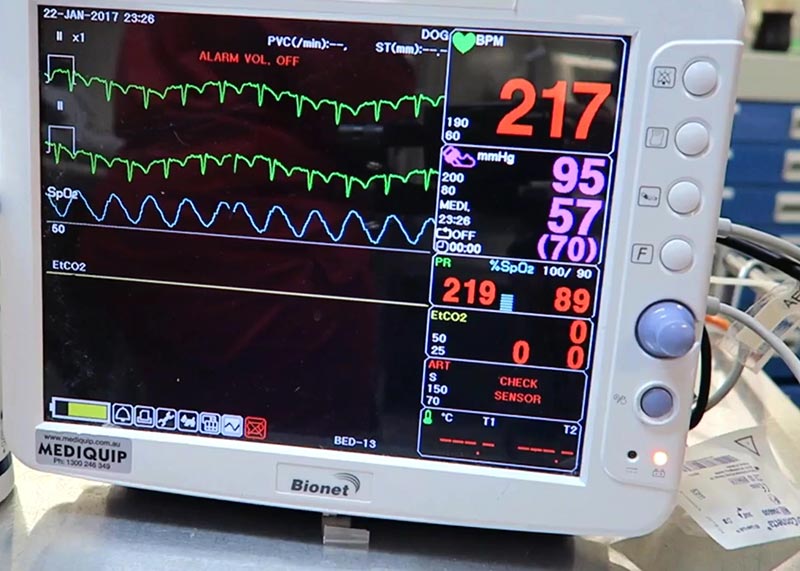
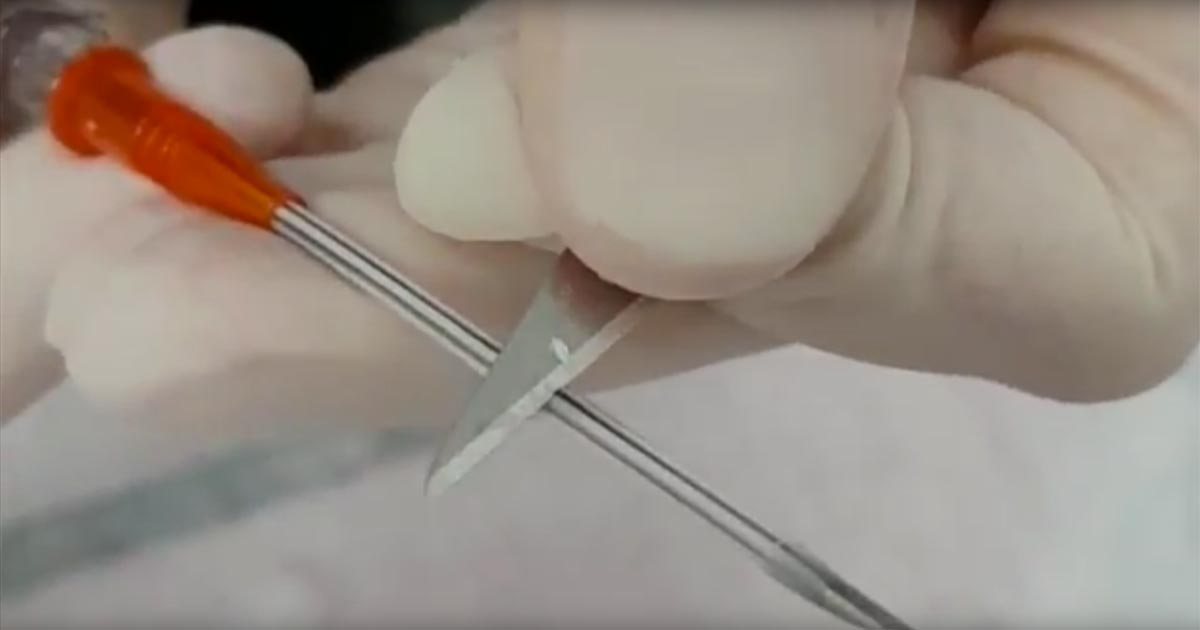
    As was initially advertised to us, the clinic we found ourselves working in was charity based, and so lacked many of the facilities I think I’d learned (without even realising) to take for granted back home. Instruments were sterilised in an autoclave, there was no inhalant anaesthesia available, and no patient monitoring beyond CRT, pulse and breathing rate.

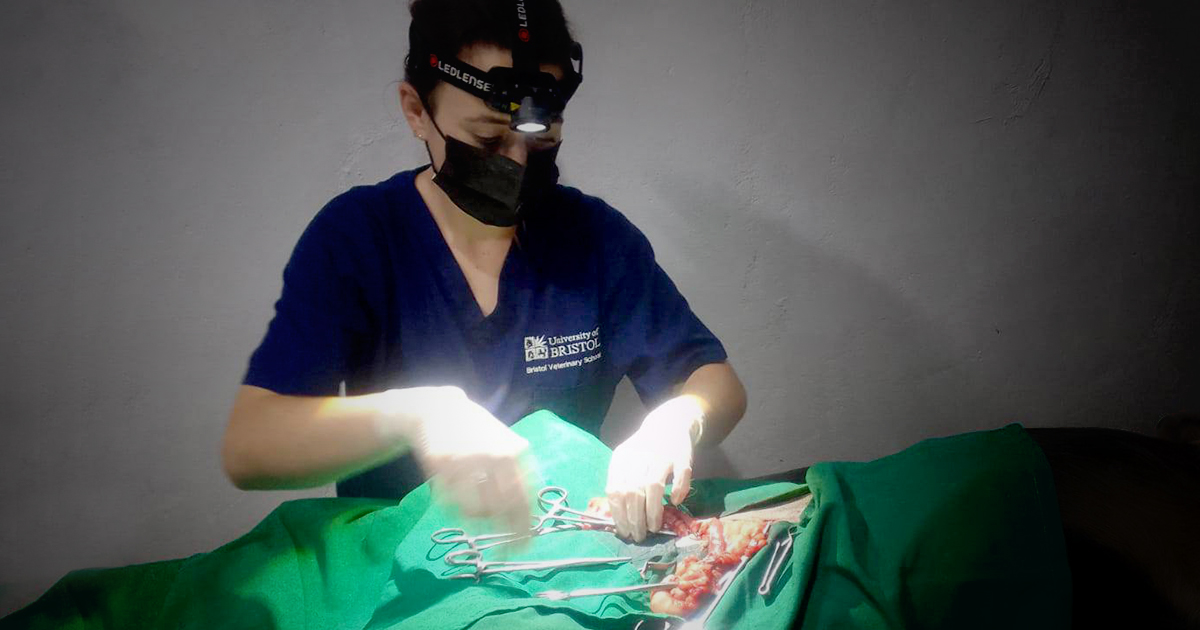
    Plus, since there was no surgical lighting, and only one table was directly beneath the light, it meant a really deep-chested bitch spay on the other end of the room felt like operating in the dark.

    How does it feel?

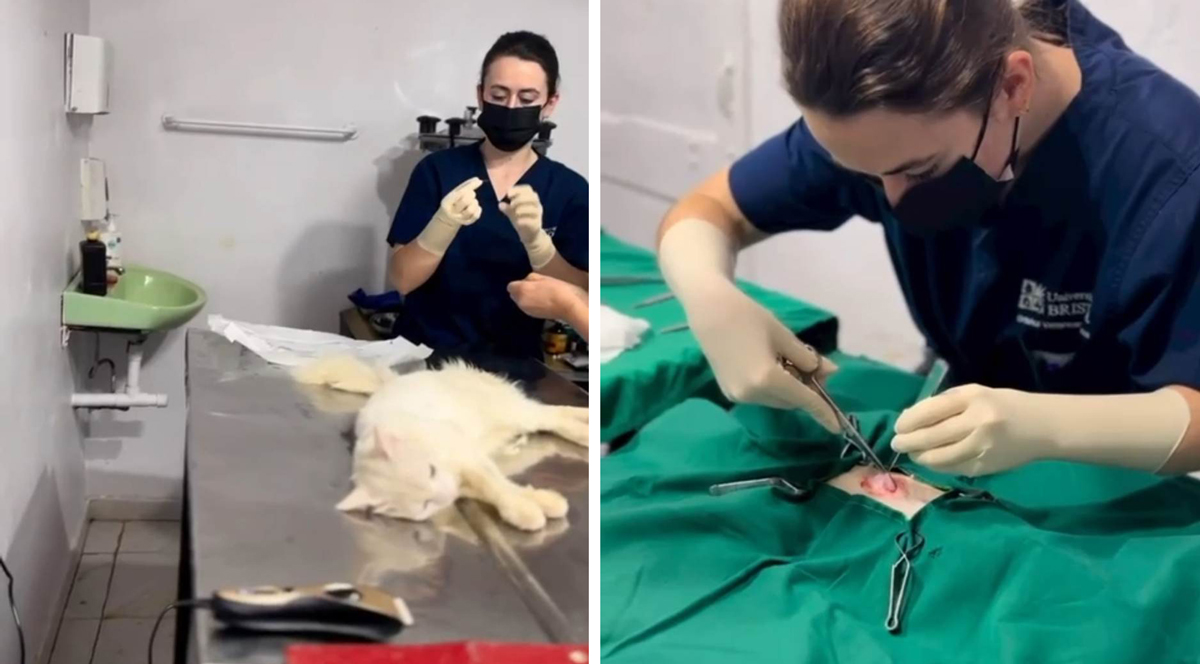
    With no surgical lighting and only one head-torch to share between the two of us, the vet monitoring us joked towards the end of the placement that I could perform surgery by braille.

    Although I wouldn’t recommend this approach to anyone, it gave me an incredible appreciation for the feel of normal versus abnormal anatomy – and that’s something no amount of revision or surgical observance could ever have given me.

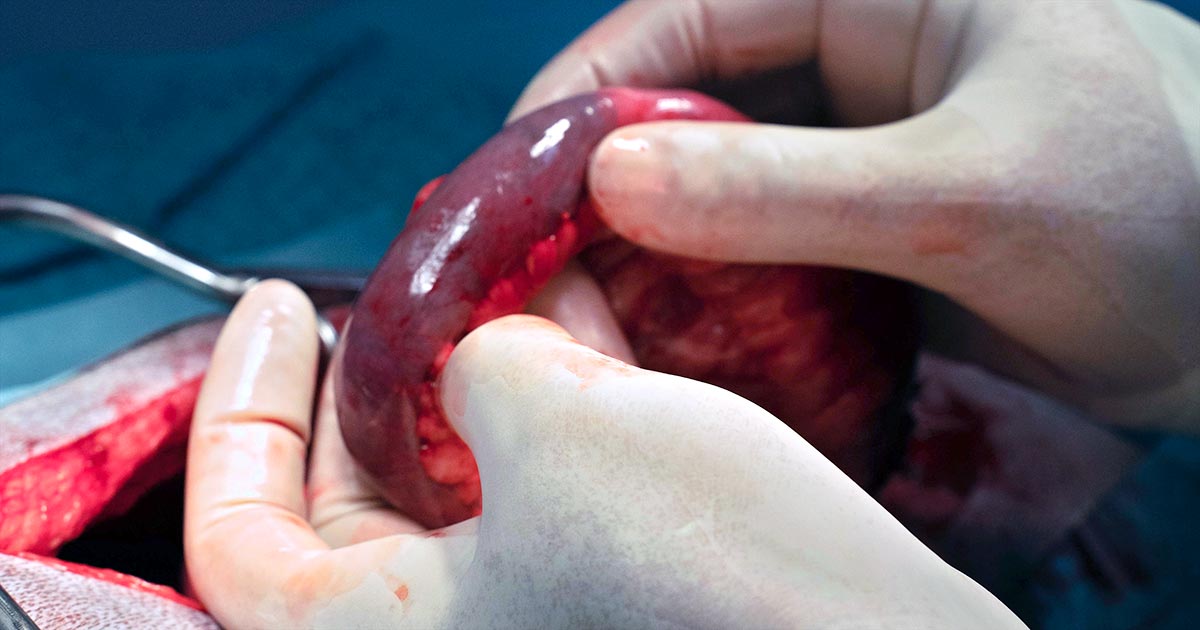
    Anaesthesia was purely parenteral, with top-ups being given as needed. We were all quite surprised by how well this worked for the majority of surgeries, with only a few hiccups along the way (and by hiccups I mean that, on one occasion, my patient turned around to look at me while I still had my fingers inside its abdomen).

    The EMS placement’s main advertising pull had been as an opportunity to gain “incredible surgical experience”, says Eleanor.

    Expect the unexpected

    No matter how much they teach you, or how well you learn the steps, there will always be a surgery – usually a bitch spay – that throws you a curveball (unfortunately, our patients haven’t read the textbook and are under no obligation to behave).

    Whether it’s a ginormous blood vessel masquerading in a portion of facia, or a large glob of fat obscuring your view, every spay (even every castrate) has the potential to be entirely different to the previous one; surgery is not an endeavour for people who can’t roll with the punches or adapt their plan to a new situation.

    I’ve heard the phrase, “no plan ever survives first contact with the enemy”, but I think my own proverb would read: “No surgical plan ever survives first contact with the patient.”

    Well taught

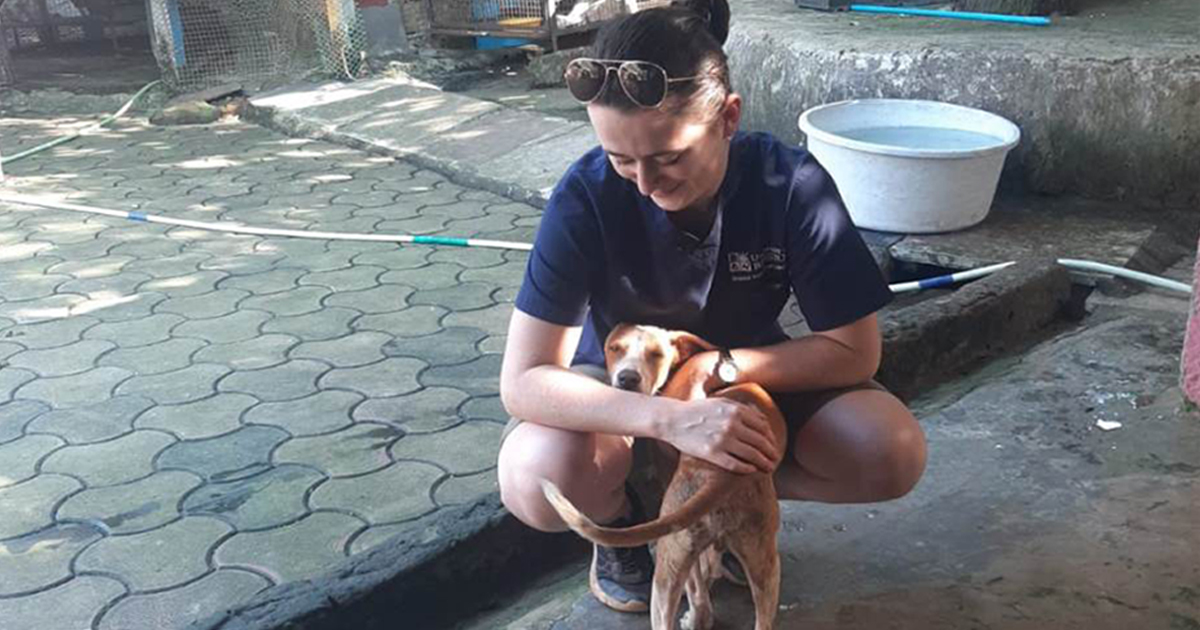
    One of the best instruments a vet can have at their disposal is support. My friend and I could not have asked for a better teacher, and the skills taught to us will undoubtedly be invaluable to us during the next stage of our careers.

    I wouldn’t say that surgical programmes like this are for the faint hearted, but it provided me with experience that I simply would not have been able to gain had I not stepped out of my comfort zone.

  • Hyponatraemia, pt 1: clinical signs

    Hyponatraemia, pt 1: clinical signs

    Hyponatraemia is a relatively common electrolyte disturbance encountered in critically ill patients, and the most common sodium disturbance of small animals.

    In most cases, this is caused by an increased retention of free water, as opposed to the loss of sodium in excess of water.

    Low serum sodium concentration

    Hyponatraemia is defined as serum concentration lower than 140mEq/L in dogs and lower than 149mEq/L in cats.

    The serum sodium concentration measured is not the total body sodium content, but the amount of sodium relative to the volume of water in the body. For this reason, patients with hyponatraemia can actually have decreased, increased or normal total body sodium content.

    This series will look briefly at the modulators of the sodium and water balance, clinical signs associated with hyponatraemia, the most common causes in small animals, the pathophysiology behind these changes, and treatment and management.

    ECF volume

    hyponatraemia
    An example of hyponatraemia.

    Sodium is the main osmotically active particle in the extracellular fluid (ECF), so is the main determining factor of the ECF volume. Any disease process that alters the patient’s ECF volume will lead to hyponatraemia, such as:

    • dehydration
    • polyuria
    • polydipsia
    • vomiting
    • diarrhoea
    • cardiac diseases
    • pleural or peritoneal effusion

    The modulators of water and sodium balance are also different, so should be thought of as different processes.

    Water balance is modulated by thirst and antidiuretic hormone, and the effect of this is to maintain normal serum osmolality and serum sodium concentration.

    Modulators of sodium balance aim to maintain normal ECF volume. It adjusts this by altering the amount of renal sodium excretion; an expansion of ECF volume will lead to an increased sodium excretion, while a reduction in ECF volume will lead to increased sodium retention.

    Rate and magnitude

    The clinical signs of hyponatraemia are both dependent on the magnitude of the decrease and the rate at which it developed.

    In mild or chronic patients, no visible clinical signs can exist. In severe (lower than 125mEq/L) and acute cases, clinical signs exhibited are typically neurological, reflecting cerebral oedema. Possibilities include:

    • lethargy
    • anorexia
    • weakness
    • incoordination
    • disorientation
    • seizures
    • coma

    Patients with acute hyponatraemia – for example, water intoxication – are more likely to show clinical signs, compared to those with chronic hyponatraemia, because the brain takes time (at least 24 to 48 hours) to produce idiogenic osmoles, osmotically active molecules that help shift free water out of brain cells.

    Therefore, any acute hyponatraemia that develops within a 24 to 48-hour period tend to show clinical signs, whereas chronic cases are less likely.

    • Next week’s blog will look into the different causes of hyponatraemia and how they result in sodium loss.
  • Tales of an Indian winter

    Tales of an Indian winter

    It had been an ambition of mine since the beginning of vet school to do some type of work abroad, whether it be preclinical or clinical, a paid position or volunteer work.

    A big reason I undertook an intercalated MSc was for the option it presented for a three-month research period in Western Australia. Sadly, COVID-19 put a stop to that and my research never wandered further than my desk – but, if anything, the pandemic made me feel even more passionate about travelling for my EMS.

    Gone to Goa

    Weekends spent “lolling on the beach” were well-deserved, says Eleanor.

    A friend and I both settled on a small rescue centre in Goa, India, for the placement (neither of us feeling quite brave enough to go it alone) and despite planning it almost a year in advance, the date caught up with us quite quickly. Before we knew it, we were there.

    Let the record show that the motivation for this trip was not to escape from the harsh English January weather, nor to fill up on delicious curries, although the temperature did make a welcome change and I’m unsure a takeaway will ever cut it again.

    The whole reason for the placement was to gain the kind of surgical experience that just isn’t readily available to students in the UK.

    Understandably, vet practices can take a while to warm up to students enough to trust them to carve into somebody’s beloved animals, but this makes for generation after generation of new grads who feel completely out of depth with a scalpel in their hands.

    Great(er than our) expectations

    The placement’s main advertising pull had been as an opportunity to gain incredible surgical experience, but we had gone into it with some trepidation that it wasn’t going to be nearly as busy and hands-on as we’d hoped. It turned out to surpass our expectations and go right out the other side…

    Weekends spent lolling on the beach were well-deserved after numerous 11-hour shifts with numb fingers and thumbs from uncooperative clamps and needle holders.

    The surgical side of the trip deserves an article of its own – but suffice it to say that, between the two of us, my friend and I neutered almost 50 dogs and cats, including 15 unassisted but supervised dog spays. It was an incredible rewarding feeling when each surgery finished, knowing we were doing even just a small bit in the effort to reduce India’s stray population.

    Eleanor found her EMS placement in Goa “incredible rewarding”.

    Learning valuable lessons

    Let it be said, I am not the most confident of travellers, and 18 hours of travel across three planes and four airports are not for the faint of heart, but neither is India – and while I have entirely fallen in love with the country, its beauty and its animals, there was a lot of disorganisation that made my poor little control-freak brain spin.

    I think that learning to take each day as it comes, and constantly adapting to new situations or pressures has taught me a lot of valuable skills in a very short space of time.

    In particular, the vet who taught and supervised us was invaluable in making the placement such a success. She gave us an incredible amount of patience and taught me skills in both surgery and how to face a stressful situation that I will carry with me throughout my career.

  • Oxyhaemoglobin dissociation curve, pt 4: left and right shift

    Oxyhaemoglobin dissociation curve, pt 4: left and right shift

    In various disease and physiological states, the oxyhaemoglobin dissociation curve (OHDC) can shift either left or right. This indicates the increase, or decrease, of the haemoglobin’s (Hgb’s) affinity to oxygen, respectively.

    It is important to recognise the situations in which this happens, to manage patients effectively.

    Right shift

    A shift of the OHDC to the right indicates the Hgb has a reduced affinity to oxygen. This is normally seen in environments where oxygen needs to be released by the Hgb molecules – for example, muscles and placenta.

    Four major factors influence this:

    • low blood pH (lactic acid)
    • high temperature – especially working muscles
    • high partial pressure of carbon dioxide (PCO2)
    • increased 2,3-bisphosphoglycerate (2,3-DPG) – an intermediate of glycolysis

    2,3-DPG

    2,3-DPG is produced in red blood cells during glycolysis. Its production is increased for several conditions in the presence of diminished peripheral tissue oxygen availability, such as hypoxaemia, chronic lung disease, anaemia and congestive heart failure. It promotes oxygen to be released into the tissues and, therefore, makes it harder for oxygen to bind with Hgb in the lungs.

    The presence of 2,3-DPG can increase oxygen release to the tissue equivalent to that if the surrounding arterial partial pressure of oxygen (PaO2) was 10mmHg higher. This is why 2,3-DPG is increased during pregnancy to increase oxygen delivery to the growing fetus.

    Another example is during exercise – in the presence of high CO2 and more hydrogen ions (H+) from lactic acid (lowering the pH), the curve is shifted to the right to help increase oxygen release in the muscles.

    Left shift

    Oxygen dissociation – left and right shift
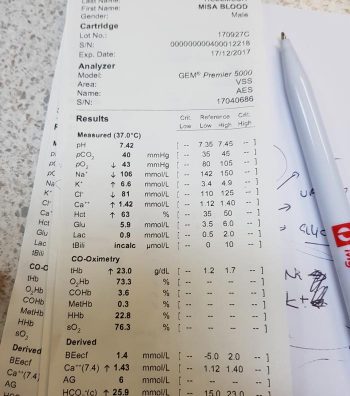
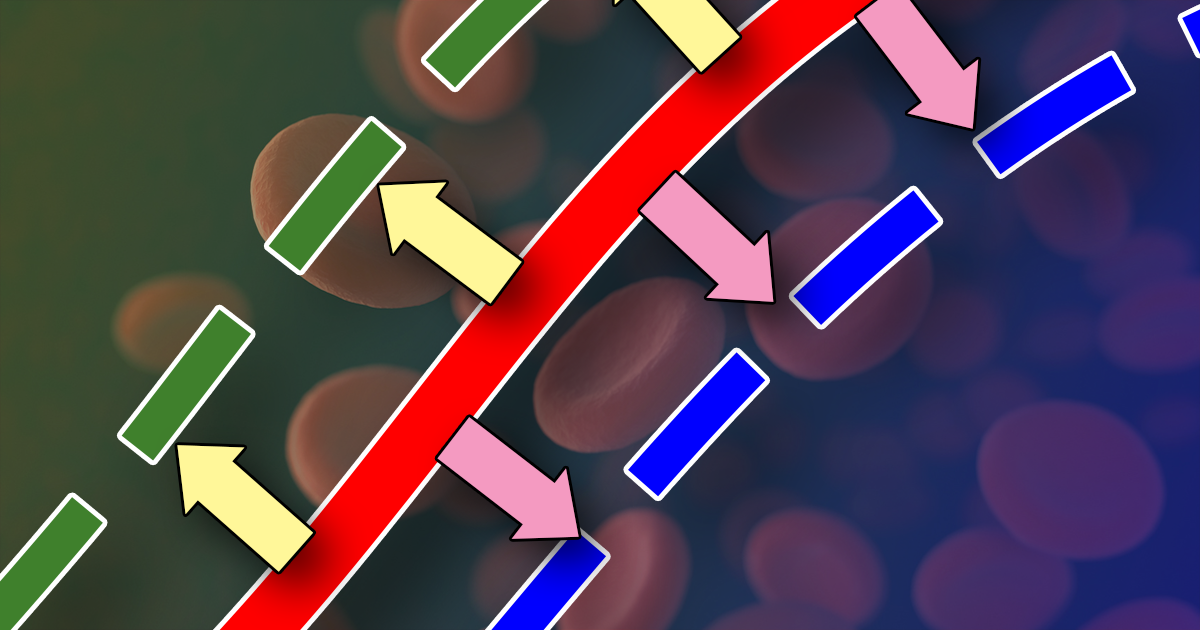
By the same token, a shift of the curve to the left means the Hgb has an increased affinity for oxygen, so is less likely to release it to the tissue. This normally occurs in the lungs.

    The factors this promotes are:

    • high blood pH (breathing off CO2 – an acid)
    • low temperature (ambient temperature usually lower than that of the lungs)
    • reduced PCO2 (ventilation)
    • decreased 2,3-DPG and the presence of fetal Hgb

    So, during exercise, in the presence of lower CO2 and less H+, the curve shifts to the left to help increase oxygen uptake into the Hgb.

    Carbon monoxide toxicity

    One pathological situation that causes a left shift of the curve is carbon monoxide (CO) toxicity.

    Not only does it cause the OHDC curve to shift to the left, but the Hgb is also 240 times more likely to bind to CO than oxygen. The situation is further complicated by pulse oximeters’ inability to differentiate CO-bound Hgb to O2-bound Hgb, therefore giving a false reading of normal partial pressure of oxygen in the face of severe hypoxaemia. Similarly, methemoglobinaemia has a similar effect to CO and causes a left shift of the OHDC.

    Conclusion

    Understanding the relationships between Hgb, oxygen saturation, PaO2 and the causes of the shifts of the curves will allow accurate assessments of patients.

    For example, a patient with unusual hypoxaemia derived from arterial blood gas – despite normal PaO2 and peripheral oxygen saturation – will immediately increase the suspicion of CO toxicity.

    Similarly, a patient presenting with shortness of breath, despite adequate ventilation and oxygen saturation, will suggest Hgb deficiency.

  • Oxyhaemoglobin dissociation curve, pt 3: what the curve means

    Oxyhaemoglobin dissociation curve, pt 3: what the curve means

    The oxyhaemoglobin dissociation curve (OHDC) is a graphical description of the relationship between the partial pressure of oxygen (PO2; x-axis) and the oxygen saturation (y-axis).

    To make sense of this graph, we need to first understand the reasons that drive oxygen movement between the haemoglobin (Hgb) and the body tissue.

    Oxygen binding affinity

    The major determinant of oxygen binding to the Hgb is the PO2, which the Hgb is exposed to. When the PO2 is high – typically in the lungs at the alveolar-capillary interface, oxygen readily binds to Hgb because of its increased affinity to oxygen.

    The opposite occurs in other body tissues, where the PO2 is less. This reduces the Hgb’s ability to maintain its binding capacity of oxygen (reduces affinity) and oxygen is released into the tissue instead.

    Looking at the OHDC, it can be seen the relationship between the arterial PO2 (PaO2) and peripheral oxygen saturation (SpO2) is not linear, and this has to do with the Hgb’s changing affinity to oxygen.

    Oxyhaemoglobin dissociation curveInitially, when the first oxygen molecule binds to Hgb’s, a change occurs in its conformation that increases its affinity for subsequent molecules of oxygen and, thus, hasten binding. This is depicted by the steep part of the OHDC curve.

    However, as more oxygen binds, the available binding sites become saturated and further increase in PaO2 doesn’t increase further additional binding. This is the flat portion of the curve where the SpO2 doesn’t increase very much, despite a constant increase in PaO2.

    The only way to further increase SpO2 is by increasing the haemoglobin content (blood transfusion) and, thus, the total oxygen carrying capacity of Hgb. This is important to factor in when treating anaemic patients, where any further increase in oxygen delivery is unlikely to benefit the overall oxygen capacity of the patient.

    Patient application

    So, we now understand the oxygen binding affinity to the haemoglobin, but how can that be applied to the patient as a whole?

    The curve is actually a graphical representation of the movement of oxygen around different parts of the body. The flat, upper portion of the curve represents the lung/alveolar interface when PO2 is usually high. In this region, the Hgb’s affinity for the oxygen is high, so very little change occurs in the SpO2 in a range of PO2 (80mmHG to 100mmHg).

    This is an important defence mechanism of the body that ensures the loading of oxygen on to Hgb is unaffected in the face of varying PO2. Once PaO2 decreases beyond 80mmHg, though, a more rapid decrease occurs in SpO2 for a given decrease in PaO2. This is the middle, steep, lower portion of the curve. This part of the curve describes the peripheral tissues where the PO2 is much lower compared to that of the lung/alveolar interface.

    Hgb’s affinity for oxygen decreases as PO2 decreases – this is why a small decrease in PO2 in this range will result in a significant reduction in SpO2. This is very important as it means peripheral tissue can withdraw large amount of oxygen for a small drop in PO2, promoting oxygen diffusion into the tissue.

    The norm for peripheral tissue is 40mmHg PaO2. If you look at the graph closely, it will be equivalent to approximately 75% SpO2. This means the tissue has been able to extract 25% of oxygen and the Hgb is left with 75% of its oxygen-carrying capacity.

    Key to understanding

    This is the graph for a typical, healthy individual. Understanding this will help make sense of what actually happens in diseased patients, or patients with physiological changes, that shifts the curve of this graph.

    By understanding the changes that occur, it is only then you can implement effective management strategies to help these patients.

  • Oxyhaemoglobin dissociation curve, pt 2: pulse oximetry’s limitations

    Oxyhaemoglobin dissociation curve, pt 2: pulse oximetry’s limitations

    Pulse oximetry is a useful, non-invasive method of measuring a patient’s oxygen saturation (SO2) and, under normal physiological circumstances, correlates well to the arterial oxygen saturation (SaO2).

    However, despite its ease of use and accessibility, it is not infallible. Circumstances exist that will undermine the accuracy of these readings – some with dire consequences if not recognised.

    Others causes are more technically associated, but also needs recognition.

    Unequal to task

    Pulse oximetry is incapable of assessing:

    • a patient’s haemoglobin levels
    • the haemoglobin’s functionality
    • the patient’s partial pressure of arterial carbon dioxide (PaCO2)

    The former is particularly apparent in anaemic patients, where peripheral capillary oxygen saturation (SpO2) readings could be greater than 95%, but animals still severely hypoxic. This is because the total numbers of haemoglobin is reduced; therefore, overall oxygen-carrying capacity is also decreased.

    Similarly, haemoglobin can be fully saturated with carboxyhaemoglobin or methaemoglobin strands, giving a misleadingly high SpO2 reading, yet patients are severely oxygen deprived.

    Finally, the ventilation status of the patient is not assessed by pulse oximetry. This is particularly important in animals with respiratory compromise, patients under heavy sedation and those under general anaesthetic or severe respiratory muscle paralysis from envenomation by a tick or snake. These patients can have near normal SpO2, but a dangerously high PaCO2.

    To overcome these problems, capnography or arterial blood gas analysis with cooximetry, and assessment of haemoglobin concentration is crucial.

    Accuracy issues

    The accuracy of pulse oximeter readings are also affected by several causes.

    Severe hypoxaemia (lower than 70% SpO2) is not accurately detected by pulse oximetry and requires partial pressure of arterial oxygen (PaO2) to confirm. Also, any cause of reduced peripheral perfusion can cause erroneously low readings, such as arrhythmias, hypotension, heart failure, hypothermia and severe vasoconstriction.

    Physical examination parameters that can indicate perfusion deficits are present include:

    • tachycardia
    • reduced pulse pressures
    • pale mucous membranes
    • prolonged capillary refill time
    • dull mentation/weakness
    • hypothermia

    It is not uncommon to stabilise a patient with hypovolaemic shock and find the SPO2 reading has normalised.

    Improving outcomes

    Although the accuracy of pulse oximetry readings are based on a large number of assumptions, it is still a valuable substitute for the measurement of PaO2 in clinically stable patients.

    Understanding the above concepts will allow you to derive a lot more information when used in the context of your patient’s oxyhaemoglobin dissociation curve and their clinical status.

    This will help improve patient outcomes, while early recognition of changes will allow prompt intervention and management of a patient’s disease.

  • Oxyhaemoglobin dissociation curve, pt 1: oxygen saturation

    Oxyhaemoglobin dissociation curve, pt 1: oxygen saturation

    With the widespread availability of pulse oximetry and its relative ease of use, it’s easy to become complacent and overly reliant on its values.

    One must remember pulse oximetry is only an indirect measurement of the arterial haemoglobin saturation, so these values are based on a series of assumptions on the other important factors that determine oxygenation.

    To understand the overall oxygen status of a patient, you will need to assess the pulse oximetry values in the context of the oxyhaemoglobin dissociation curve (OHDC).

    SaO2 and PaO2

    The OHDC depicts the relationship between oxygen saturation of haemoglobin (SaO2) and the partial pressure of arterial oxygen (PaO2). However, before discussing the interpretation of the OHDC graph, we must understand the difference between SaO2 and PaO2:

    • SaO2 refers to the percentage of haemoglobin molecule within red blood cells that is bound to oxygen. Each haemoglobin molecule is made up of four strands of amino acids, each of which are able to bind to one molecule of oxygen. When these binding sites are fully saturated (bound), this is reflected as 100% oxygen saturation.
    • PaO2 is the partial pressure of oxygen dissolved in blood (expressed in mmHg) – or, more simply put, the measurement of oxygen content in arterial blood. The higher the PaO2, the more readily oxygen binds to haemoglobin.

    Influences

    Pulse oximetry for a patient with hypoxaemia.
    Pulse oximetry for a patient with hypoxaemia.

    Aside from SaO2 and PaO2, other important elements exist that determine the effectiveness of oxygenation of tissue, both in terms of oxygen delivery and oxygen dissociation (offloading from haemoglobin).

    The efficiency of oxygen transport is influenced by:

    • the number of haemoglobin molecules available for oxygen uptake
    • a sufficient blood volume
    • a competent circulatory system (cardiac output and blood pressure)

    Oxygen dissociation from haemoglobin molecules to the target tissue is directly determined by the tissue demand for oxygen.

    It should be noted none of these factors are assessed by the pulse oximeter, thus highlighting the limited value of pulse oximetry in the absence of the knowledge of these other factors and the context of the OHDC.

    So, the first key point is the number displayed on the pulse oximeter should not be interpreted in isolation.

    The goal of the next couple of posts is to help you understand the limitations of pulse oximeters, what the OHDC means, what factors can affect this curve, and how to interpret pulse oximetry values in the context of the curve to get a more accurate picture of the patient’s overall oxygenation status.

  • To resect, or not to resect…

    To resect, or not to resect…

    To resect or leave in a piece of intestine that is concerning you is a common source of stress when performing exploratory laparotomies.

    In many cases, this is straightforward; in some, it can be difficult to decide.

    The risk is if you leave in a piece of intestine and it devitalises, then leakage of intestinal contents into the abdomen occurs, leading to septic peritonitis – the situation we all dread.

    Criteria

    In this post, I cover some criteria I use to assess intestinal viability.

    These are all subjective criteria that require familiarity with what is normal, as well as good judgement, to be reliable; however, they are the only realistic criteria available for general use.

    Arterial pulsations in the mesenteric arteries that are feeding the affected areas

    This is the most important criteria, and it can be the most reliable criterion for assessing intestinal viability.

    It goes without saying – if there is no blood supply, there is no oxygen being delivered – resulting in tissue death.

    Intestinal tissue color

    It is important to remember the colour can change quite dramatically in a short period of time.

    Once an obstruction has been removed, perfusion to that area will be restored and the colour can change rapidly. Tissues that are dark in colour can turn dark red then bright red with time.

    Often, I give the section of questionable intestine time after I have removed an obstruction to see what colour it changes to. If the tissue is black or grey and does not improve, I would consider resection.

    Wall texture

    This can be a difficult thing to appreciate, but it can be helpful to compare a healthy segment of intestine to the affected segment of intestine.

    When you squeeze and roll a piece of healthy intestine between your thumb and index finger, it should feel thick and springy, whereas intestine that has lost viability can feel “thin”.

    Peristalsis

    The presence of peristalsis can be helpful and is a good sign. The absence of peristalsis is not an automatic indicator of poor intestinal viability, as it can take some time for motility to return in severe cases.

    Partial thickness incision

    Finally, a small partial thickness incision can help if you are really stuck.

    If there is effective blood supply to the tissues then the blood should be normal and bright red in colour, as it is oxygenated; poor blood supply will mean the blood will remain dark and blue tinged, indicating poor oxygenation.

    Concerning signs

    The criteria that makes me very concerned – and would make me lean towards resection – include:

    • black, grey discoloured intestine
    • absent arterial pulsations
    • absence of peristalsis
    • thin wall thickness
    • dark, deoxygenated blood from a partial thickness incision

    If I have concerns and it will not result in a significant loss of small intestinal length, I would remove the intestine rather than leave it in.

    If you are removing large segments, I would wait longer to see whether time and blood supply will help improve the health of the intestinal tract enough to feel comfortable leaving more of it in.

  • Cracking your centesis capabilities

    Cracking your centesis capabilities

    There’s nothing like hitting the jackpot when performing a centesis and getting the catheter in the sweet spot, enabling you to easily and effectively drain fluid/air from a cavity.

    On the flip side is the frustration and disappointment when the catheter stops draining and you know so much more in there could have been removed.

    Here is a little trick I was taught, which has helped me countless times.

    When using a large bore catheter, I make small fenestrations along the catheter – about 1cm apart, alternating sides. This essentially increases the number of holes air or fluid can drain through.

    It is safest with large catheters as smaller ones may snap and remain inside the patient.

    How to…

    Check out this short video to watch how it is done.

    It is a small trick that really works and can make a big difference.

    Why not try it next time?

  • Feline aortic thromboembolism

    Feline aortic thromboembolism

    If a cat comes in unable to walk, consider the three Ps:

    • pain
    • paralysis
    • pulselessness

    gerardo_paws
    Figure 1. Colour change in the paws of a cat.

    Feline aortic thromboembolism (FATE) should be on top of your differentials.

    Figure 1 demonstrates the colour change in the paws of an affected cat outlining blood flow: the pink pad is the unaffected cat’s front paw, while the pale pad is on the affected hind limb that will be cold to the touch.

    Cardiological problems

    Often FATE is a secondary condition in cats with heart disease.

    The heart forms clots in the distal aorta that occlude flow to the femoral arteries. With the femoral arteries being the main arteries providing blood flow to the hind limbs, symptoms become apparent.

    Symptoms can include:

    • sudden hind limb paralysis
    • cold hind limbs
    • vocalising
    • pain